SPL Graph


Detailed App Info:
Application Description
SPL Graph is an audio level chart recorder for the iPhone and iPod Touch. It works by averaging the SPL for one second, applying an optional weighting filter, and plotting the sound level.
** Important **
This app is also available as a module within AudioTools, at a lower price. If you are planning to buy iAudioInterface or iProMic, or if you want one bundled audio app. you should download AudioTools and buy this app from within AudioTools rather than buying it here, since there is no way to transfer purchased apps.
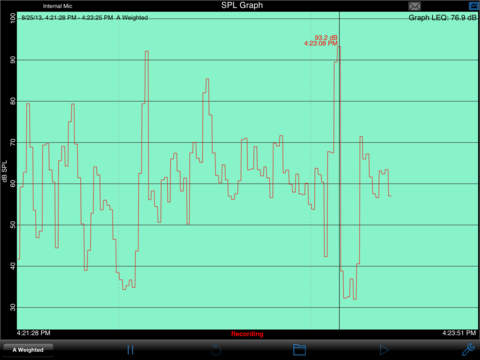
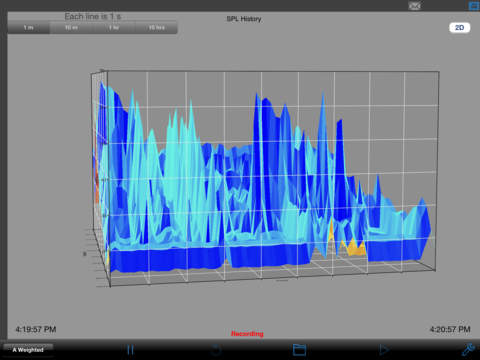
SPL Graph can record up to 24 hours of sound level data, with single second resolution. The graph starts with a one-minute window, and as a minute is recorded, the graph re-scales automatically and adds another minute to show the data collected so far.
Tap the green play button to play back the recorded audio, and use the cursor to scrub the audio location on the graph. Use this feature to listen to events that you can see on the graph.
You can scroll and scale the graph vertically, in dB, by using standard swipe and pinch gestures. You can also scroll and expand and contract the time axis using gestures. Zoom out to a full 24 hours, or zoom in to a single minute, showing second resolution. Double-tap the screen to zoom out to show the entire graph on the screen.
The time scale grid changes dynamically, highlighting minutes, ten-minute, and hour lines as as it runs.
As the graph runs, the overall LEQ (average SPL) for the entire time period is computed and displayed on the screen. Swiping across the graph brings up a cursor that displays the exact dB level and time for any point on the graph.
You can turn on audio recording, so that you have a record of the sounds that were happening while the graph was being stored. You can use this to figure out exactly what the sound was that caused a peak on the graph, for example.
If you exit the app, or are interrupted with a phone call, the graph data will not be lost. SPL Graph will automatically save the graph, and reload it when you next open the program. You can also save a graph in one of ten files on the iPhone, so that you can recall the graph later.
SPL Graph supports saving up to 10 graphs directly on your iPhone or Touch. You can recall these graphs and bring them up on the screen, and listen to the sounds that were made while the graph was recorded. You can also store an image of the screen to your photo roll.
The filters are all ANSI type 1 or better, and include A-weighting, C-weighting, and all octaves band filters from 32 to 16kHz.
Like all Studio Six Digital audio apps, SPL Graph supports calibration. The app ships calibrated for a typical iPhone 3G. If you have access to a calibrated SPL meter you can calibrate your iPhone.
NOTE: This app was renamed from "LEQ Graph".
You can use SPL Graph on an iPod Touch second generation by using a headset microphone. If you have first generation Touch, you can use the app only with a third-party microphone input adapter. See our web site for more detail.
Also, see our other great audio and acoustical analysis apps: AudioTools, SPL, SPL Meter, RTA, ETC, RT60, FFT, Generator, and Speaker Pop.
And, if you are looking for great audio test equipment, check out the Sencore SoundPro line of analyzers.
** Important **
This app is also available as a module within AudioTools, at a lower price. If you are planning to buy iAudioInterface or iProMic, or if you want one bundled audio app. you should download AudioTools and buy this app from within AudioTools rather than buying it here, since there is no way to transfer purchased apps.
SPL Graph can record up to 24 hours of sound level data, with single second resolution. The graph starts with a one-minute window, and as a minute is recorded, the graph re-scales automatically and adds another minute to show the data collected so far.
Tap the green play button to play back the recorded audio, and use the cursor to scrub the audio location on the graph. Use this feature to listen to events that you can see on the graph.
You can scroll and scale the graph vertically, in dB, by using standard swipe and pinch gestures. You can also scroll and expand and contract the time axis using gestures. Zoom out to a full 24 hours, or zoom in to a single minute, showing second resolution. Double-tap the screen to zoom out to show the entire graph on the screen.
The time scale grid changes dynamically, highlighting minutes, ten-minute, and hour lines as as it runs.
As the graph runs, the overall LEQ (average SPL) for the entire time period is computed and displayed on the screen. Swiping across the graph brings up a cursor that displays the exact dB level and time for any point on the graph.
You can turn on audio recording, so that you have a record of the sounds that were happening while the graph was being stored. You can use this to figure out exactly what the sound was that caused a peak on the graph, for example.
If you exit the app, or are interrupted with a phone call, the graph data will not be lost. SPL Graph will automatically save the graph, and reload it when you next open the program. You can also save a graph in one of ten files on the iPhone, so that you can recall the graph later.
SPL Graph supports saving up to 10 graphs directly on your iPhone or Touch. You can recall these graphs and bring them up on the screen, and listen to the sounds that were made while the graph was recorded. You can also store an image of the screen to your photo roll.
The filters are all ANSI type 1 or better, and include A-weighting, C-weighting, and all octaves band filters from 32 to 16kHz.
Like all Studio Six Digital audio apps, SPL Graph supports calibration. The app ships calibrated for a typical iPhone 3G. If you have access to a calibrated SPL meter you can calibrate your iPhone.
NOTE: This app was renamed from "LEQ Graph".
You can use SPL Graph on an iPod Touch second generation by using a headset microphone. If you have first generation Touch, you can use the app only with a third-party microphone input adapter. See our web site for more detail.
Also, see our other great audio and acoustical analysis apps: AudioTools, SPL, SPL Meter, RTA, ETC, RT60, FFT, Generator, and Speaker Pop.
And, if you are looking for great audio test equipment, check out the Sencore SoundPro line of analyzers.
Requirements
Your mobile device must have at least 15.35 MB of space to download and install SPL Graph app. SPL Graph was updated to a new version. Purchase this version for $9.99
If you have any problems with installation or in-app purchase, found bugs, questions, comments about this application, you can visit the official website of Andrew Smith at http://www.studiosixdigital.com.
Copyright © Andrew Smith