Plot On


Detailed App Info:
Application Description
Plot On lets you create your own graphs for everyday figures like expenses, savings, weight, domestic energy consumption, car mileage, reading for exams, or running/bicycling pace.
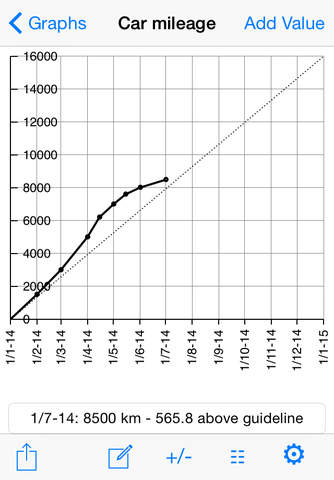
A Plot On graph visualizes how a certain value changes during a period of time. The X-axis represents time, while the Y-axis represents the value.
You set up a graph for a certain period of time, with expected start value and end value. As you later add real values to the graph, Plot On displays a curve visualizing the real progression compared to the guideline given by the expected endpoints.
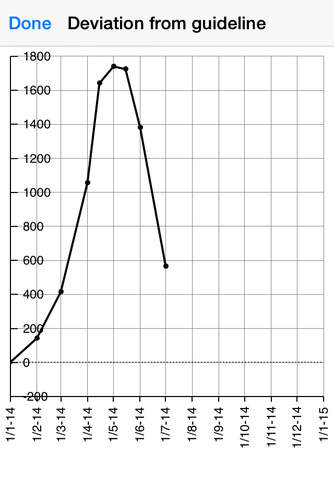
By comparing your graph with the guideline, you can easily see whether you are approaching your goal or not.
When adding a value to your graph, Plot On tells you exactly how much this value differs from the guideline - whether it is above or below, or if it´s a "spot-on".
A Plot On graph visualizes how a certain value changes during a period of time. The X-axis represents time, while the Y-axis represents the value.
You set up a graph for a certain period of time, with expected start value and end value. As you later add real values to the graph, Plot On displays a curve visualizing the real progression compared to the guideline given by the expected endpoints.
By comparing your graph with the guideline, you can easily see whether you are approaching your goal or not.
When adding a value to your graph, Plot On tells you exactly how much this value differs from the guideline - whether it is above or below, or if it´s a "spot-on".
Requirements
Your mobile device must have at least 1.36 MB of space to download and install Plot On app. Plot On was updated to a new version. Purchase this version for $0.00
If you have any problems with installation or in-app purchase, found bugs, questions, comments about this application, you can visit the official website of Gunnar Bjelland at http://www.facebook.com/plotonapp.
Copyright © 2012 Gunnar Bjelland