iGraph - Basic


Detailed App Info:
Application Description
*** Featured in iTunes ***
"iGraph - Basic" app helps the user to plot and create lines on a graph. A line chart or line graph is a type of chart which displays information as a series of data points connected by straight line segments.
It is a basic type of chart common in many fields. It is similar to a scatter plot except that the measurement points are ordered (typically by their x-axis value) and joined with straight line segments. A line chart is often used to visualize a trend in data over intervals of time – a time series – thus the line is often drawn chronologically.
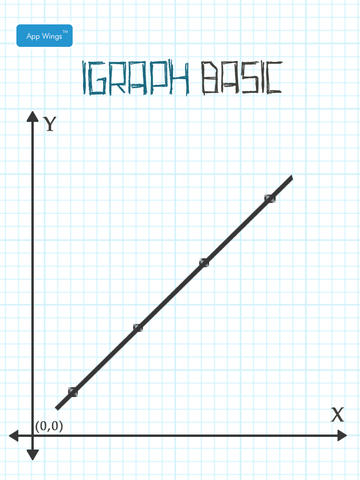
Requirements
Your mobile device must have at least 3.89 MB of space to download and install iGraph - Basic app. iGraph - Basic is available on iTunes for $0.99
If you have any problems with installation or in-app purchase, found bugs, questions, comments about this application, you can visit the official website of Saravanan K at http://apps.appwings.com/igraph_basic.html.
Copyright © AppWings