Data Graphs I

Detailed App Info:
Application Description
Learn IT lessons are designed in a way easy to understand and improve problem solving skills. It makes math friendlier for students who struggle in math.
The Mathematical concepts are explained through Animated examples and Voice instructions. These examples are solved with a step by step solution.
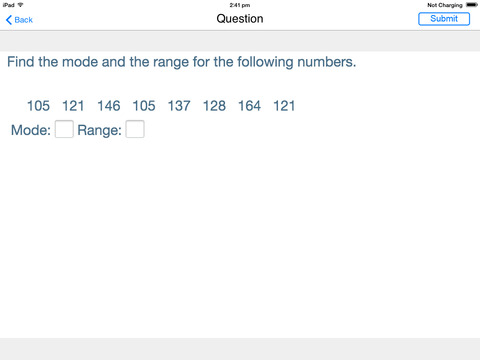
Students can test their level of understanding through checkpoints in between the lessons. This App is based on the curriculum of Middle and High School Algebra.
Learn IT:
Lessons were developed by Learn IT in partnership with PITSCO education. PITSCO's math and science products are widely used by students.
Features:
100% offline
Explore the different ways of organizing data such as diagrams, tables, and graphs. Tree diagrams show possible outcomes, Tables show precise values, Circle graphs show characteristics of data, and Double-bar graphs to compare data. Learn to create a stem-and-leaf plot, which shows the numbers in order.
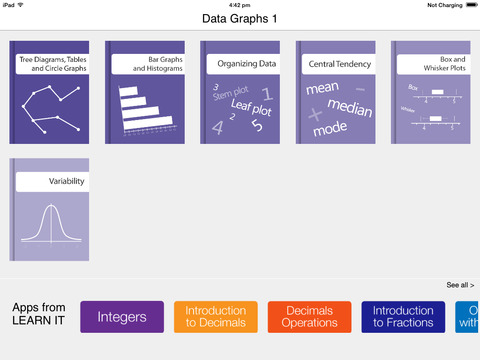
This unit of instruction includes the following 6 lessons:
Tree Diagrams, Tables and Circle Graphs
-Learn about the different ways to organize data.
-Use tree diagrams, tables, and circle graphs to organize data and find solutions.
Bar Graphs and Histograms
-Analyze data in single-bar graphs, double-bar graphs, and histograms.
-Learn the steps to create a histogram.
Organizing Data
-Evaluate data to create stem-and-leaf plots.
-Use back-to-back stem-and-leaf plots.
-Create a line plot.
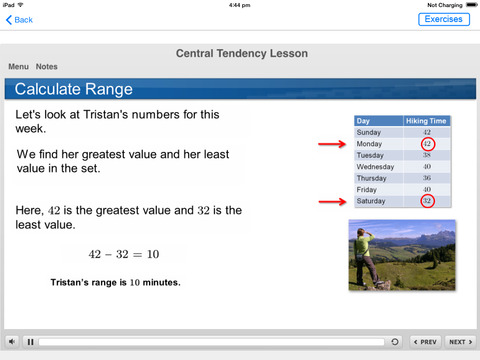
Central Tendency
-Calculate mean, median, mode, and range.
Box-and-Whisker Plots
-Understand quartiles.
-Identify the parts of a box-and-whisker plot.
-Learn how to show data in box-and-whisker plots.
Variability
-Learn about variability.
-Calculate range and standard deviation.
-Define normal distribution.
Other Apps from Learn IT:
Integer
Decimal Operation
Intro to Decimals
Angles
Angle Relationships
Calculators
Functions
Matrices
Logic and Sequences
Data Graphs II
Graphing Calculators
Accuracy
Linear Equations and Graphing
Triangles
Units
Operations with Fractions II
Polynomials
Special Equations
Quadratics
Factoring
Exponential Equations
More Apps coming soon:
Intro to Fractions
Transformations
Exponents
Circles
Polygons
Sets
Prisms and Pyramids
Absolute Value
Inequalities
Real Number System
Probability
Properties of Real Numbers
Ratios and Percents
Radicals
Operations with Fractions I
Equations
System of Equations
Our Website: http://www.learnitapps.com/
The Mathematical concepts are explained through Animated examples and Voice instructions. These examples are solved with a step by step solution.
Students can test their level of understanding through checkpoints in between the lessons. This App is based on the curriculum of Middle and High School Algebra.
Learn IT:
Lessons were developed by Learn IT in partnership with PITSCO education. PITSCO's math and science products are widely used by students.
Features:
100% offline
Explore the different ways of organizing data such as diagrams, tables, and graphs. Tree diagrams show possible outcomes, Tables show precise values, Circle graphs show characteristics of data, and Double-bar graphs to compare data. Learn to create a stem-and-leaf plot, which shows the numbers in order.
This unit of instruction includes the following 6 lessons:
Tree Diagrams, Tables and Circle Graphs
-Learn about the different ways to organize data.
-Use tree diagrams, tables, and circle graphs to organize data and find solutions.
Bar Graphs and Histograms
-Analyze data in single-bar graphs, double-bar graphs, and histograms.
-Learn the steps to create a histogram.
Organizing Data
-Evaluate data to create stem-and-leaf plots.
-Use back-to-back stem-and-leaf plots.
-Create a line plot.
Central Tendency
-Calculate mean, median, mode, and range.
Box-and-Whisker Plots
-Understand quartiles.
-Identify the parts of a box-and-whisker plot.
-Learn how to show data in box-and-whisker plots.
Variability
-Learn about variability.
-Calculate range and standard deviation.
-Define normal distribution.
Other Apps from Learn IT:
Integer
Decimal Operation
Intro to Decimals
Angles
Angle Relationships
Calculators
Functions
Matrices
Logic and Sequences
Data Graphs II
Graphing Calculators
Accuracy
Linear Equations and Graphing
Triangles
Units
Operations with Fractions II
Polynomials
Special Equations
Quadratics
Factoring
Exponential Equations
More Apps coming soon:
Intro to Fractions
Transformations
Exponents
Circles
Polygons
Sets
Prisms and Pyramids
Absolute Value
Inequalities
Real Number System
Probability
Properties of Real Numbers
Ratios and Percents
Radicals
Operations with Fractions I
Equations
System of Equations
Our Website: http://www.learnitapps.com/
Requirements
Your mobile device must have at least 2.73 MB of space to download and install Data Graphs I app. Data Graphs I is available on iTunes for $4.99
If you have any problems with installation or in-app purchase, found bugs, questions, comments about this application, you can visit the official website of Learn It Applications LLC at http://www.learnitapps.com.
Copyright © Learn It Applications, LLC 2011